Project Overview
pypgsvg is a powerful Python tool that automatically generates interactive SVG Entity Relationship Diagrams from PostgreSQL database schemas. Originally created to processes PostgreSQL dump files can now directly connect to a postgresql database with command line argunents to analyze abstract or visual documentation.
Technologies Used
Installation
Available on PyPI for simple installation with pip:

Interactive SVG Generation & Visualization
Creates stanalone dynamic, explorable diagrams that can be embedded in documentation and presentations.
- Dynamic layout algorithms for optimal table positioning
- Interactive hover states showing detailed column information
- Clickable relationships for relationship exploration
- Responsive design that scales for different screen sizes
- Export capabilities for documentation and presentations
SVG rendering engine with post-processing coordinate calculation, CSS styling integration, and JavaScript event handling for interactivity.
Interactive hover effects and relationship highlighting
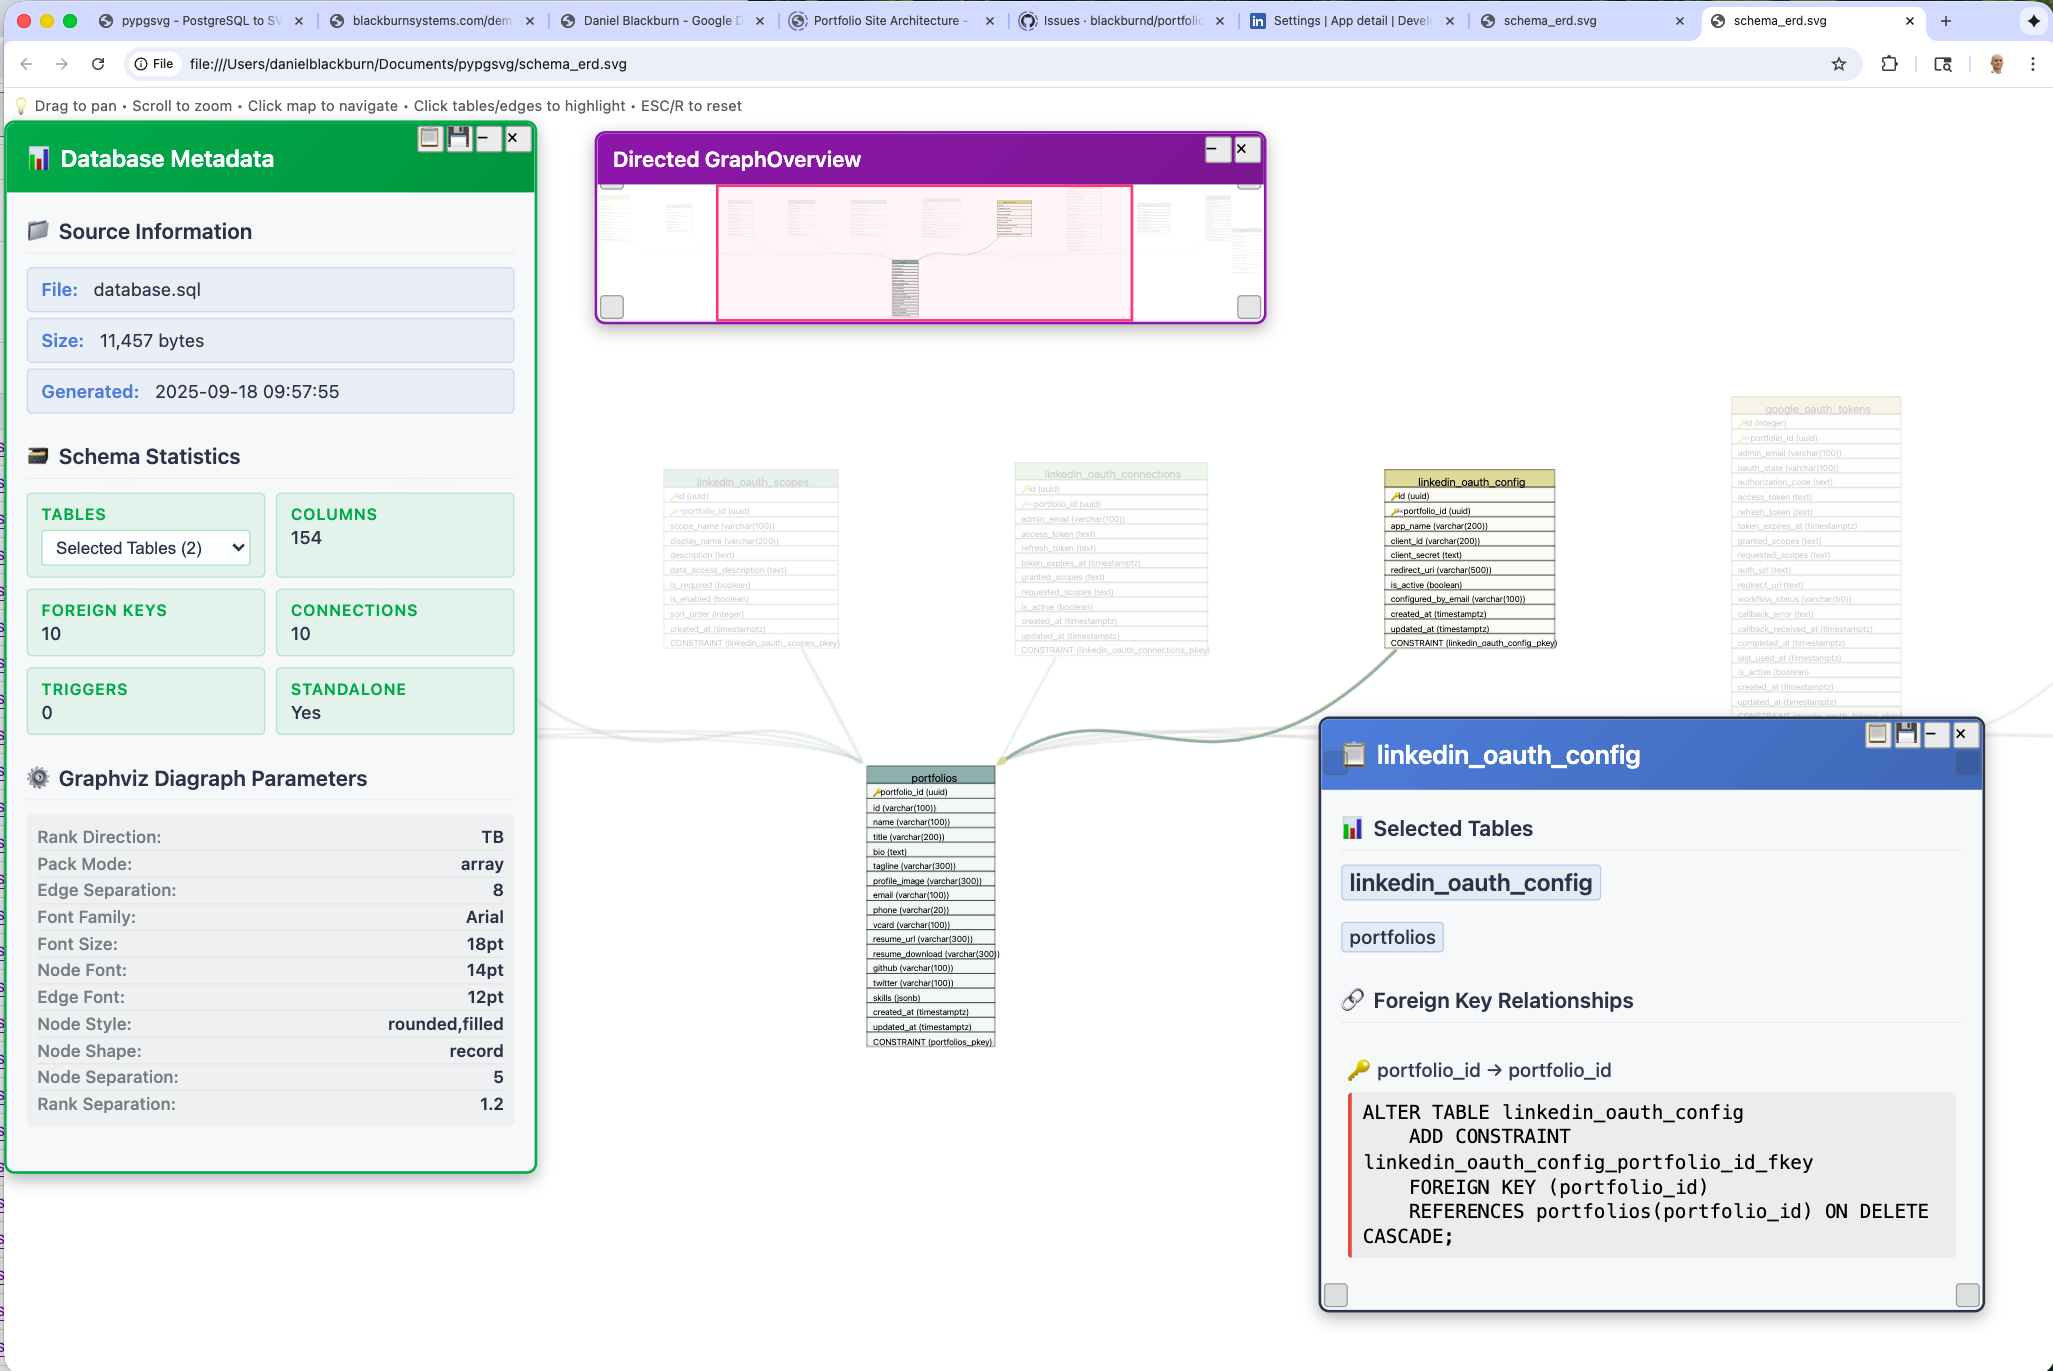
This is the pypgsvg output of a more interesting database schema of a recent project with the informational popups hidden. Grab the image to move and mousewheel to zoom, for the full experience see the full screen version.
Technical Implementation
pypgsvg demonstrates advanced database introspection and dynamic SVG generation capabilities, solving real-world documentation challenges for database-driven applications.
Usage & Automation
Designed as a command-line tool, pypgsvg is also callable from applications real-time ERD generation. This portfolio site demonstrates live PostgreSQL schema visualization using the tool.
The application supports key Graphviz layout options including rankdir,
nodesep, and packmode for customizable diagram layouts. Being
fully scriptable, it integrates seamlessly into CI/CD pipelines to keep documentation
synchronized with database changes.
Command-line interface with some of the configuration options.